Plot utilities
The plot_utils module contains functions that
can be used to plot the MCMC chains produced by PTArcade. On this page,
we give some examples of the module functionalities. A more detailed
discussion can be found on its reference page.
plot_chains-
This function can be used to produce trace plots of the chains. For example, let's say that you have a set of chains in
This will produce the following:./out/model/. You can produce their trace plots as follows:
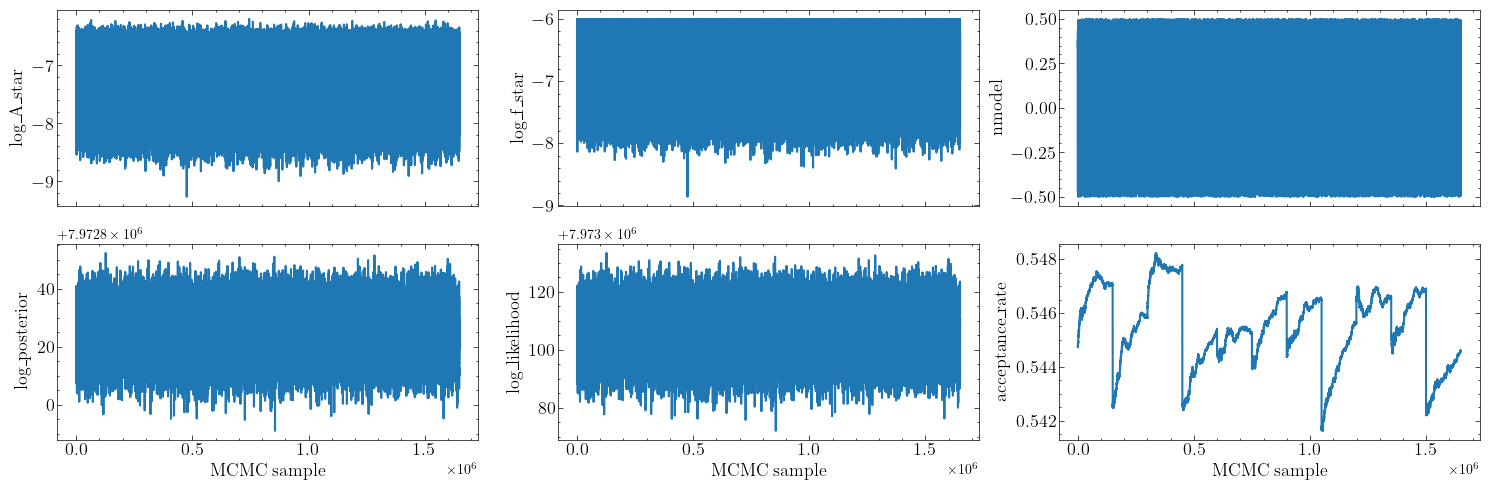
By default, plot_chains will only produce
trace plots for the user-specified parameters which are common across pulsars,
together with the trace plots for the MCMC parameters (likelihood, posterior, and
hypermodel index). If you want to produce trace plots for a different subset of the
parameters, you can do it by using the params_name argument.
plot_posteriors-
This function can be used to produce posterior plots from MCMC chains:
This will produce the plot below
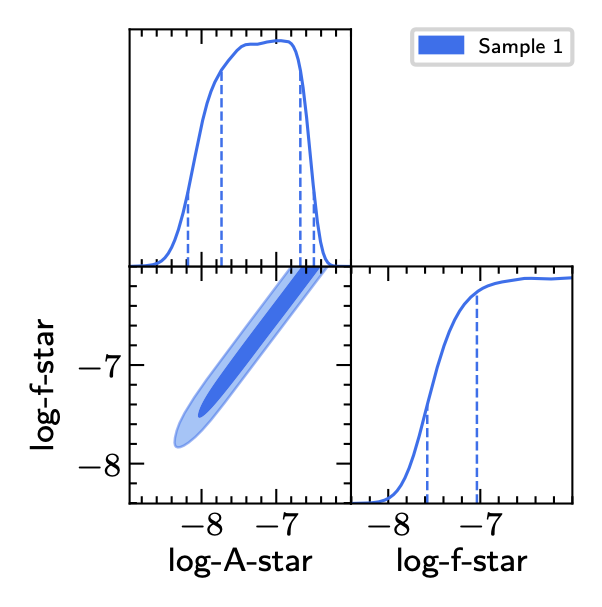
For more details on how to control the appearence of this plot see here.